
America’s housing market is expensive, transactions are weak, and buyers are frustrated. But the financial conditions that turned the 2008 housing downturn into a foreclosure crisis are largely absent today.
In 2008, falling home prices exposed a mortgage market built on fragile credit. In 2026, high mortgage rates are keeping buyers and sellers apart, but most existing homeowners are sitting on years of accumulated equity and relatively inexpensive debt. Today’s housing slowdown is primarily a problem of affordability and low transaction volume.
Mortgage Lending: From Easy Credit to Stronger Underwriting
Mortgage lending rules were relatively lax before the 2008 financial crisis due to a combination of policy choices, market incentives, and regulatory gaps that encouraged easier credit, especially for low income borrowers. The mortgage market now operates under different rules. Post-crisis regulations strengthened income verification, ability-to-repay requirements, and oversight of risky loan products.
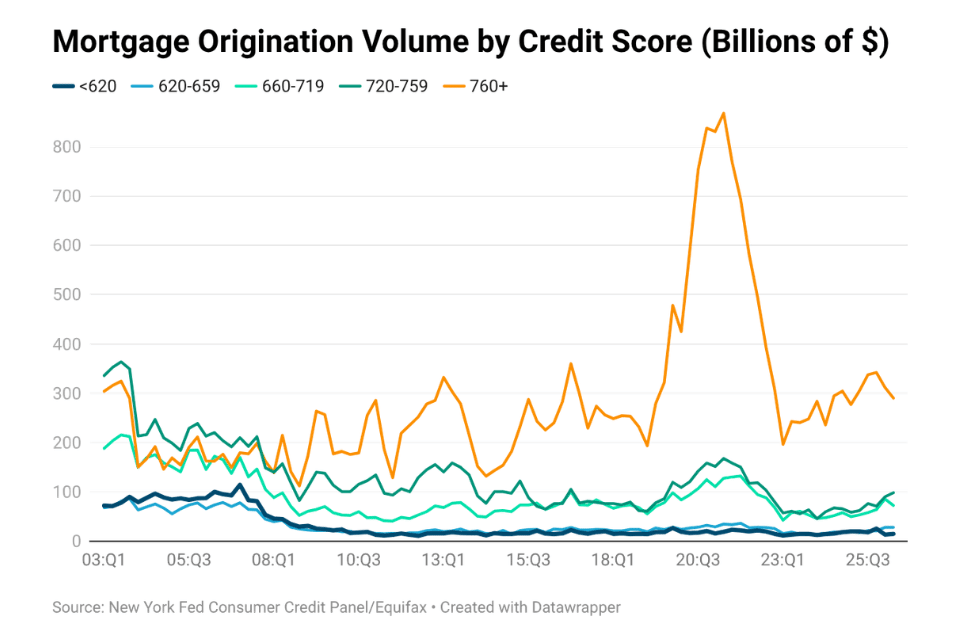
The financial crisis of 2006-2008 was driven by risky mortgages given to borrowers with weak credit. The Federal Reserve Bank of New York reports that mortgage origination volume with a credit scores less than 660 amounted to a share of over 22% in total mortgage originations during the years 2004-2007, compared to a share of 10% or less since 2010.
Home Equity: The Biggest Difference From 2008
The most consequential change is on household balance sheets. Federal Reserve data show that homeowners held approximately $35.8 trillion in real estate equity in the second quarter of 2026. Owner-occupied real estate was valued at approximately $49.8 trillion, against roughly $14 trillion in residential mortgage debt. That implies an aggregate equity share of about 72%.
This cushion changes how a housing downturn unfolds. A homeowner with a $500,000 property and a $250,000 mortgage (50% equity) could withstand a 20% price decline and still retain $150,000 in equity, before selling costs. In 2008, falling prices pushed many highly leveraged borrowers underwater, leaving them owing more than their properties were worth. Foreclosures added inventory, which depressed prices further and created another round of mortgage losses. Today, a price decline would first reduce accumulated homeowner wealth. It would not immediately erase equity for most borrowers.
Aggregate figures conceal differences across households, however. Recent buyers with small down payments have much less protection than longtime owners.
Stock Market Wealth: Another Financial Buffer
Housing is no longer the only major source of household wealth. The Federal Reserve estimates that household net worth reached approximately $195.9 trillion in the second quarter of 2026. Directly held corporate equities represent about $74 trillion of household financial assets, which have risen from $38.6 trillion in 2022. Rising stock valuations and retirement account balances give some homeowners resources beyond their properties. Financial assets can help households absorb unexpected expenses, avoid distressed sales, or make larger down payments.

But this protection is uneven. Equity ownership is concentrated among higher-income and wealthier households. A homeowner with a modest retirement account cannot necessarily use it to cover mortgage payments without taxes, penalties, or sacrificing future savings.
There is another vulnerability: a sharp stock market decline accompanied by rising unemployment could weaken both financial wealth and housing demand. Today’s stronger balance sheets offer protection, not immunity.
Mortgage Rates: Why Homeowners Aren't Selling
One of today’s defining housing market distortions barely existed in the same form in 2008: millions of homeowners have mortgages carrying interest rates far below those available to new buyers. According to FHFA data, around 50% of outstanding mortgages still carried rates below 4% in Q2 2026, compared with prevailing 30-year fixed mortgage rates around 6.4% during the same period. Moving means surrendering that financing advantage.
A homeowner with a 3% mortgage may prefer to renovate, postpone retirement relocation, or remain in a home that no longer fits rather than borrow at twice the interest rate. This produces a housing market where affordability suppresses demand while mortgage lock-in restrains supply. Instead of widespread forced selling, the adjustment occurs through fewer transactions.
Why Aren't Home Prices Crashing?
Housing prices are determined by the interaction of demand, available supply, and sellers’ willingness or need to transact. High mortgage rates have weakened purchasing power. Yet homeowners with fixed-rate loans, accumulated equity, and stable employment generally have little financial incentive to accept steep discounts.
The latest FHFA House Price Index shows national home prices increased 2.4% between August 2025 and August 2026. That is modest growth, not the rapid appreciation of the pandemic years, but neither is it a national collapse. Price declines can still occur in individual markets where supply grows faster than demand. The national figure does not imply that every homeowner is gaining equity.
The crucial difference is that today’s sellers are generally less financially compelled to sell than the highly leveraged borrowers who entered foreclosure during the previous crisis.
Foreclosures: The Clearest Evidence That 2026 Is Not 2008
The foreclosure numbers reveal how differently today’s mortgage market is functioning. According to the Federal Reserve Bank of New York, approximately 55,160 consumers had a new foreclosure recorded on their credit reports in the second quarter of 2026, compared with 52,800 a year earlier. Foreclosures have edged higher but remain far below the levels recorded during the financial crisis.
In the second quarter of 2009, new foreclosures reached approximately 566,180, more than ten times the latest quarterly figure. The New York Fed estimates that nearly 2 million new foreclosures occurred during 2009 alone, as falling home prices, excessive mortgage debt, and rising unemployment reinforced one another.
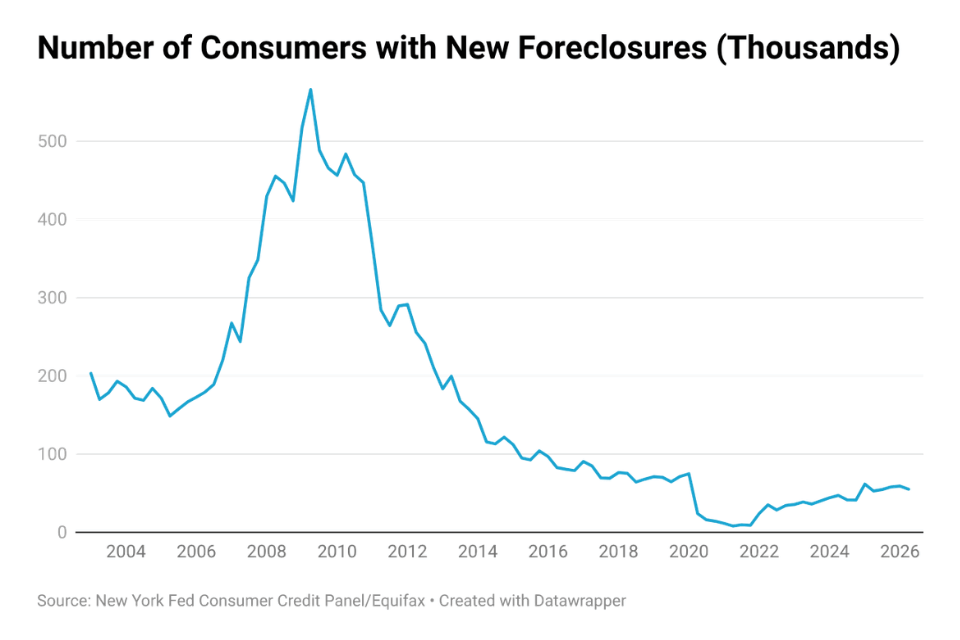
Mortgage distress is increasing in some segments of today’s market. The share of mortgage balances transitioning into serious delinquency rose from 1.29% in the second quarter of 2025 to 1.52% in the second quarter of 2026. Yet the current level of foreclosure activity remains far removed from the forced-selling cycle that accelerated the 2008 housing collapse.
That difference helps explain why weaker home sales have not translated into a nationwide price crash. Without a comparable wave of distressed properties entering the market, sellers generally have more room to wait rather than accept steep price reductions.
What Could Change the Outlook?
The strongest defense against a 2008-style downturn is the combination of homeowner equity, mortgage credit quality, and fixed-rate financing.
The greatest threat would be prolonged labor market deterioration. Job losses can turn manageable mortgage payments into unaffordable obligations, even for borrowers with good credit. A simultaneous decline in stock prices would weaken household wealth, while falling home values would reduce the equity available to borrowers needing to sell.