Economic Indicators
Indicators that provide signals about the current state and future direction of the economy and the housing market.
30-yr Fixed Rate Mortgage
| JUN. 2025 | JUN. 2026 | DEC. 2026 FORECAST |
|---|---|---|
| 6.8% | 6.5% | 6.3% |
30-yr FRM: Freddie Mac®, Forecast: Veros
Unemployment Rate
| JUN. 2025 | JUN. 2026 | DEC. 2026 FORECAST |
|---|---|---|
| 4.1% | 4.2% | 4.4% |
Unemployment rate: Bureau of Labor Statistics, Forecast: Veros
Inflation Rate
| JUN. 2025 | JUN. 2026 | DEC. 2026 FORECAST |
|---|---|---|
| 2.7% | 3.5% | 2.9% |
Inflation: Bureau of Labor Statistics, Forecast: Veros
Hourly Earnings
| JUN. 2025 | JUN. 2026 |
|---|---|
| $36.36 | $37.64 |
Source: Bureau of Labor Statistics
Housing Inventory
| JUN. 2025 | JUN. 2026 |
|---|---|
| 1.54 Million | 1.56 Million |
Source: National Association of Realtors
Housing Starts
| JUN. 2025 | JUN. 2026 |
|---|---|
| 1.379 Million | 1.427 Million |
Source: Census.gov
Housing Market Hotness Index
Discover housing market trends with the Market Hotness Index, a weekly metric utilizing proprietary data on housing activity, demand, and supply indicators across the top 100 U.S. counties.
- The Market Hotness Index is formulated through a combination of proprietary data pertaining to housing activity and demand and supply indicators for the 100 most populous counties in the U.S.
- The index is scheduled to be disseminated weekly and serves as a metric to identify markets gaining momentum or waning. A market exhibiting a score in the 95-105 range on this index is considered a stable market, with a score surpassing this range implying a hotter market, and a score below 95 indicating a cooling market.
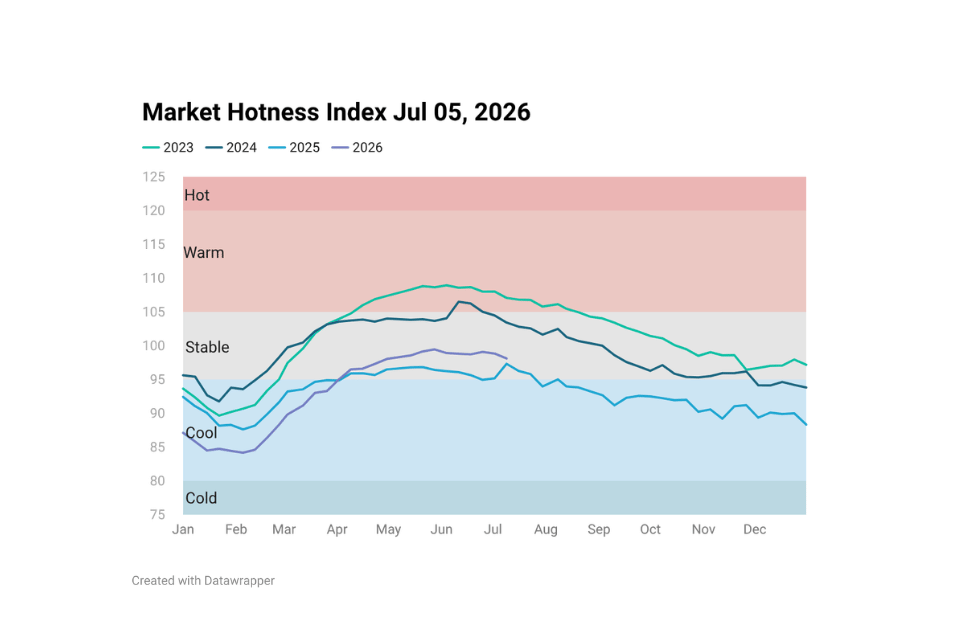
Housing Market Hotness Index Jul 05, 2026
The U.S. Housing Market Hotness Index declined slightly to 98.11, reflecting continued weakness in the housing market as existing home sales remained below historical norms. Persistent affordability challenges, mortgage rates in the mid-6% range, inflation, and economic uncertainty continue to dampen buyer activity.
Read More →
Housing Market Hotness Index Jun 28, 2026
The Housing Market Hotness Index declined slightly to 98.84 for the week ending June 28, 2026, reflecting a housing market that remains constrained by affordability and broader economic uncertainty. Elevated mortgage rates, persistent inflation, and the lock-in effect continue to limit both buyer demand and housing supply.
Housing Market Hotness Index Jun 21, 2026
The Housing Market Hotness Index increased to 99.09 for the week ending June 21, 2026, signaling a modest improvement in housing market activity. However persistent affordability challenges and fading expectations for Federal Reserve rate cuts continue to limit buyer demand.
Housing Market Hotness Index Jun 14, 2026
The U.S. housing market remains sluggish as the spring homebuying season comes to an end, with the Housing Market Hotness Index declining to 98.72 for the week ending June 14, 2026. Affordability constraints, economic uncertainty, and the ongoing lock-in effect are keeping both buyers and sellers on the sidelines.
Housing Market Hotness Index Jun 07, 2026
The Housing Market Hotness Index edged lower for the week ending June 7, 2026, highlighting the ongoing challenges facing the housing market. High mortgage rates, affordability constraints, and economic uncertainty are keeping many buyers and sellers on the sidelines.
Housing Market Hotness Index May 31, 2026
After gaining momentum through much of the spring, the housing market showed signs of slowing during the week ending May 31, 2026, as higher mortgage rates and geopolitical uncertainty weighed on buyer and seller activity.