The rapid price growth and intense competition of the past few years in the housing market is a thing of the past. While many markets remain seller-dominant, buyer demand has moderated due to high mortgage rates and affordability concerns. This might result in longer listing times and more negotiating room for buyers. Regional disparities continue to exist with some regions posting strong growth while others are witnessing a correction. After hitting highs in 2023, mortgage rates have shown a welcome decrease in recent weeks. This could potentially rekindle some buyer demand, depending on how sustained the downward trend is. Despite the dip, mortgage rates remain significantly higher than historical averages. This, combined with high home prices, continues to challenge affordability for many potential buyers. Buyers are prioritizing affordability and focusing on homes within their budget, potentially leading to longer searches and a more cautious approach.
Demand Indicators
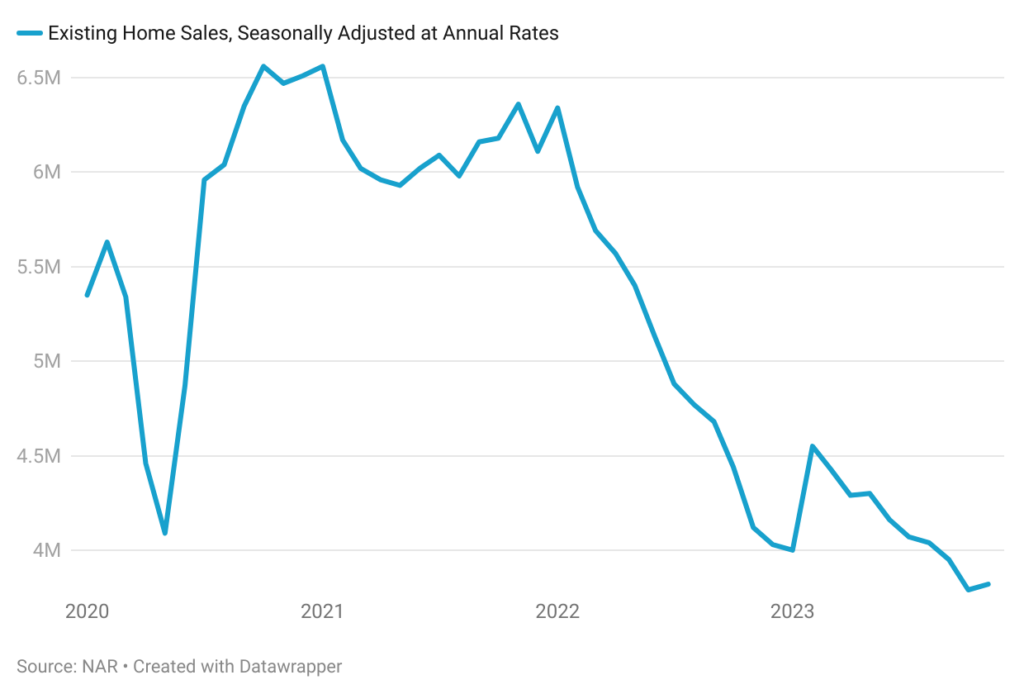
- Existing Home Sales
Data from the National Association of Realtors shows that existing home sales were at a seasonally adjusted annual rate of 3.82 million in November 2023 compared to 4.12 million in November 2022 and 3.79 million in October 2023. This reflects the very low housing supply as well as a cool-off in buyer demand due to elevated mortgage rates and affordability concerns.

- New Home Sales
After a period of strong growth in early 2023, new home sales have fallen significantly in recent months. In November 2023, sales were 12.2% lower than in October. Higher mortgage rates are a major factor contributing to the decline in sales. They make new homes less affordable for potential buyers, especially first-time buyers with limited down payments.
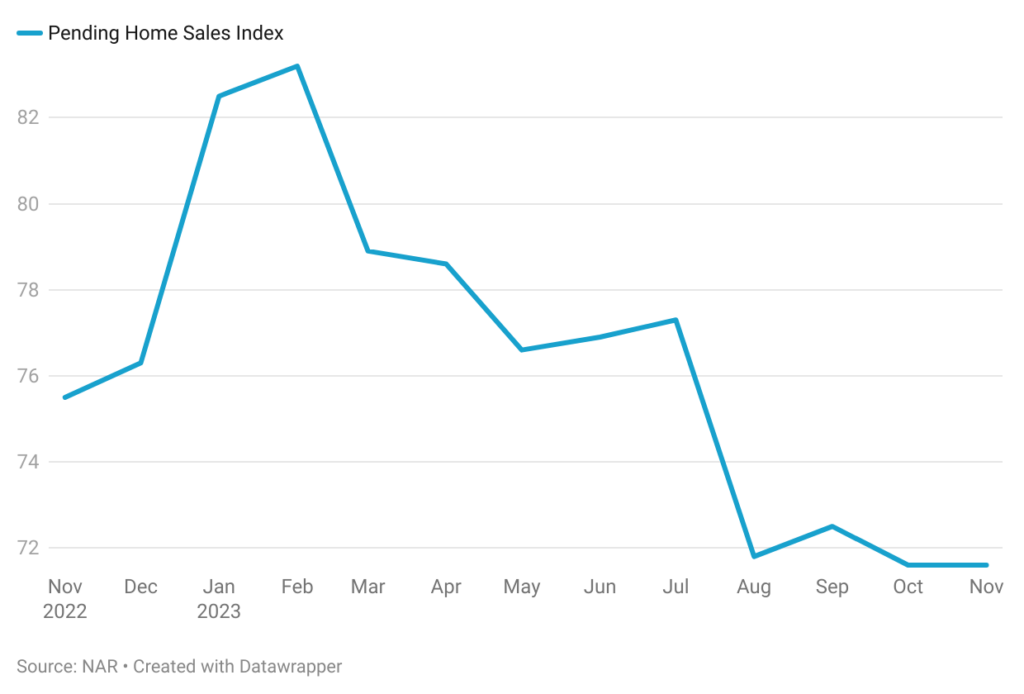
- Pending Home Sales (PHS) Index
The PHSI Index tracks contracts signed on existing homes, usually occurring a month or two before the actual sale closes. This gives us a glimpse into future activity before official sales data is available, as most contracts eventually lead to closings. Data on pending home sales released by the National Association of Realtors shows that the index was steady in November compared to the level in October but declined from the level a year ago.
Supply Indicators
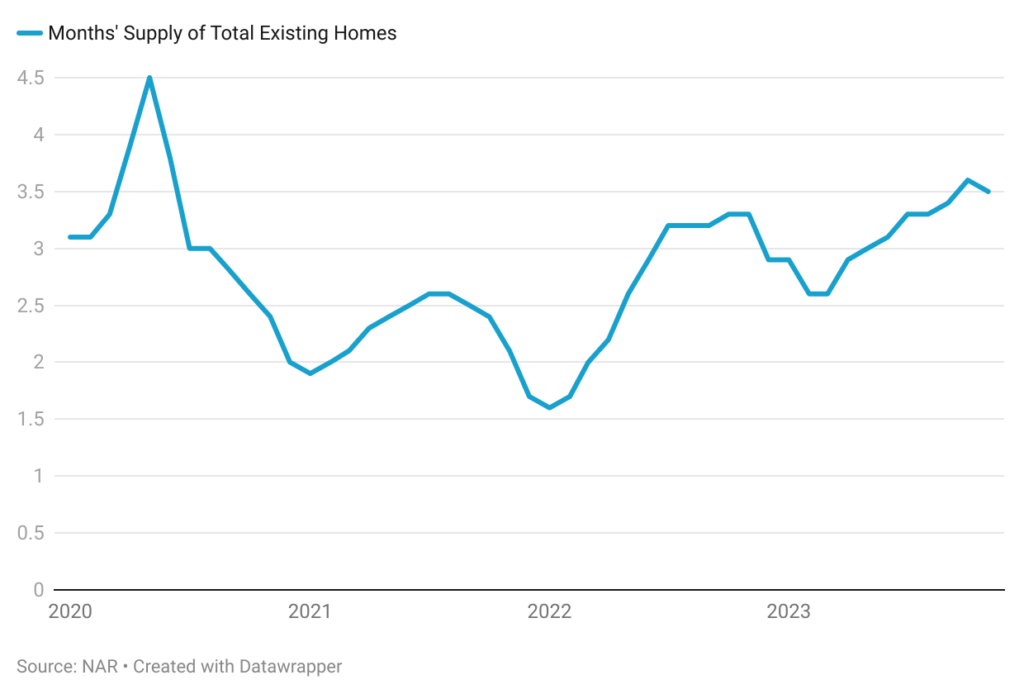
- Months of Inventory
In November, the average months’ supply across the US stood at 3.5 months, compared to 2.4 months in November 2020. The rise in months’ supply signifies a shift from the sellers’ market dominance of the past few years towards a more balanced market. With more homes available for sale, buyers have greater choice and bargaining power. While still historically high, the increase in months’ supply could put downward pressure on home prices in some areas, especially those with higher inventory levels. However, this trend is likely to vary depending on local market dynamics and overall economic conditions.
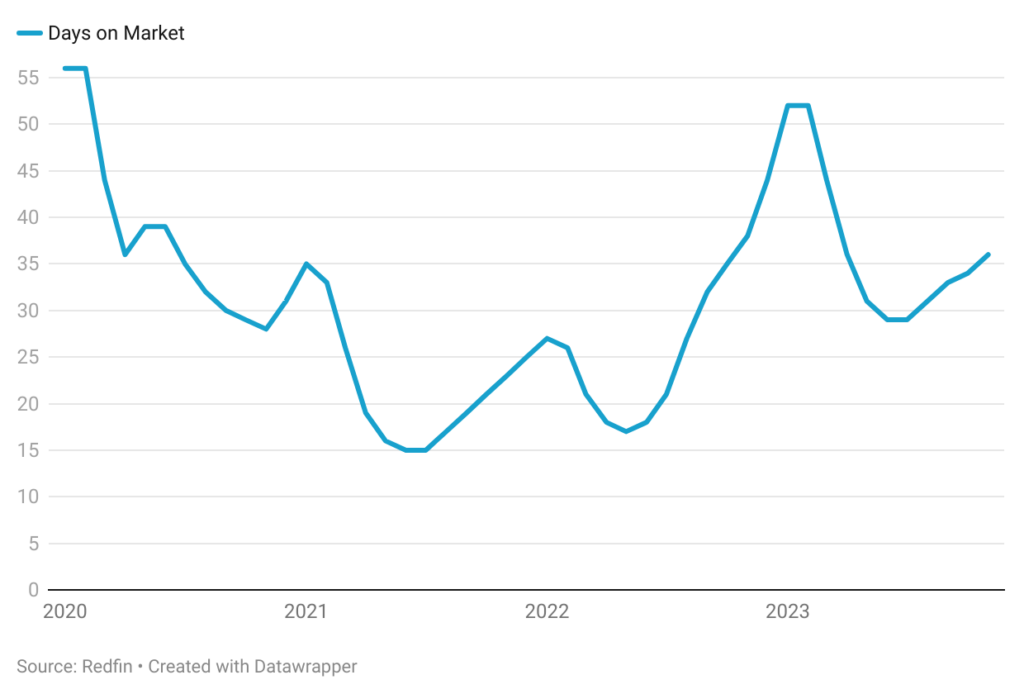
- Days on Market
To Redfin, a national real estate brokerage, days on market for existing homes has increased compared to its levels in 2022. Rising mortgage rates and economic uncertainty are making buyers more cautious, leading to slightly longer decision-making periods, and potentially pushing up days on market in certain markets. As the seller’s market dominance moderates, buyers have more options and may take longer to choose a suitable property, contributing to the rise in this metric.
The indicators outlined above point towards a subdued housing market in 2024, along with expectations of unemployment ticking up and mortgage rates remaining elevated. Persistent supply constraints are expected to prevent a decline in average home prices across the US. This, coupled with the high mortgage rates, will likely continue to pose affordability challenges for numerous prospective home buyers.