A puzzling dynamic in today’s economy is the disconnect between a weakening labor market and a still-low unemployment rate. In August 2025, the U.S. added just 22,000 jobs, with previous months revised sharply downward. Despite this clear evidence of cooling, the unemployment rate edged up only slightly, to 4.3%, a figure that still sits near historic lows. Yet, beneath the surface, cracks are forming since healthcare and social assistance drove nearly all job gains, while sectors such as manufacturing and professional services saw job losses. At the same time, the average duration of unemployment is creeping higher, signaling that it is taking longer for displaced workers to find new opportunities.
How Labor Force Definitions Shape the Numbers
To understand why the unemployment rate remains low despite these weak signals, it helps to look at how the labor force is defined. Each month, the Census Bureau surveys about 60,000 households through the Current Population Survey. Anyone aged 16 or older is either in the labor force or out of it. To be counted in the labor force, you must be employed, or unemployed but actively looking for work within the last four weeks and available to start. Everyone else, that is, retirees, full-time students not working, stay-at-home parents, or discouraged workers who have given up looking, are out of the labor force. The unemployment rate is defined as the people who have a job or are looking but cannot find one. It does not include people who are not looking for work because they have given up, people who are working at jobs that don’t utilize their skills, or people in disability. The official unemployment rate is the share of people who are not working but are actively trying to find work compared to the total number of people in the labor force.
If people give up looking for jobs, they are removed from the labor force count, which makes the unemployment rate appear lower than the true level of joblessness. As a result, the headline number can appear deceptively healthy even as labor force participation stalls. A broader measure of unemployment, U-6, captures discouraged workers, marginally attached workers, and part-timers seeking full-time work. U-6 typically runs much higher than U-3 and provides a more complete picture of hidden slack in the labor market. In August 2025, the headline unemployment rate was 4.3% compared to the U-6 unemployment level of 8.1%.
Demographics, Migration, and Workforce Stagnation
Long-term structural shifts are also at play. Retirements are accelerating as baby boomers age out of the workforce, shrinking the pool of available workers. More than 11,200 Americans will turn 65 every day or over 4.1 million every year, from 2024 through 2027, according to estimates from the Retirement Income Institute at the Alliance for Lifetime Income. However, many are choosing not to retire, partly due to rising life expectancy, meaning they need to save more. Many prefer a longer work life rather than a prolonged retirement. At the same time, participation among working mothers has fallen sharply, with women aged 25–44 with young children dropping out of the labor force at the fastest rate in three years. Return-to-office mandates, high childcare costs, and inflexible work arrangements are driving this retreat.
Further, immigration, another key source of labor supply, has also slowed dramatically. Net international migration is projected to decline in 2025, with estimates ranging from just over 100,000 new entrants to a net loss of more than 500,000 people. Meanwhile, international student enrollment, particularly in master’s-level STEM programs has fallen, shrinking the pipeline of potential skilled workers. With fewer new entrants, the labor force is expected to remain tight.
What It Means for Housing
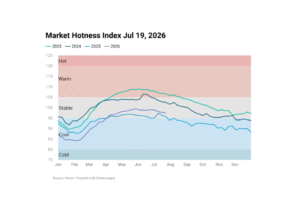
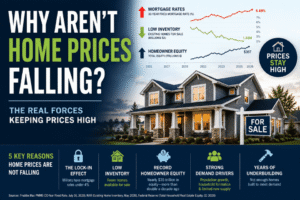
Labor market weakness is spilling into the housing market. Job insecurity is causing many would-be buyers to delay major financial commitments. Even with mortgage rates easing to around 6.3% (Sep 25, 2025) on expectations of further Fed cuts, affordability remains strained. National home prices are still about 50% higher than they were at the start of the decade, making ownership out of reach for many households. Existing home sales highlight this hesitation, falling to an annualized pace of about 4 million in August, which is well below pre-pandemic levels of more than 5 million.
While the headline unemployment rate paints a picture of stability, it masks underlying fragility. Retirements, discouraged workers, declining immigration, and weaker labor force participation all help explain why the number looks better than conditions feel. Unless job growth strengthens and consumer confidence improves, lower mortgage rates alone may not be enough to ignite a full housing recovery.