As the U.S. housing market continues to evolve, one takeaway has become unmistakably clear: location matters more than ever. While national headlines often highlight broad trends like slowing price growth and affordability struggles, the reality on the ground varies sharply from one metro area to the next. Data and forecast reports show a distinct divide between regions that are gaining traction and those struggling to maintain momentum.
Markets Positioned for Relative Strength
Several markets across the Northeast and Midwest continue to stand out as relative winners heading into 2026. These regions avoided the steepest price surges seen elsewhere during the pandemic and have become attractive due to comparatively better affordability, steady demand, and balanced supply. According to Veros’ forecasts, some markets within these regions are expected to see stronger prices and sales performance in the year ahead, even as broader national growth remains modest.
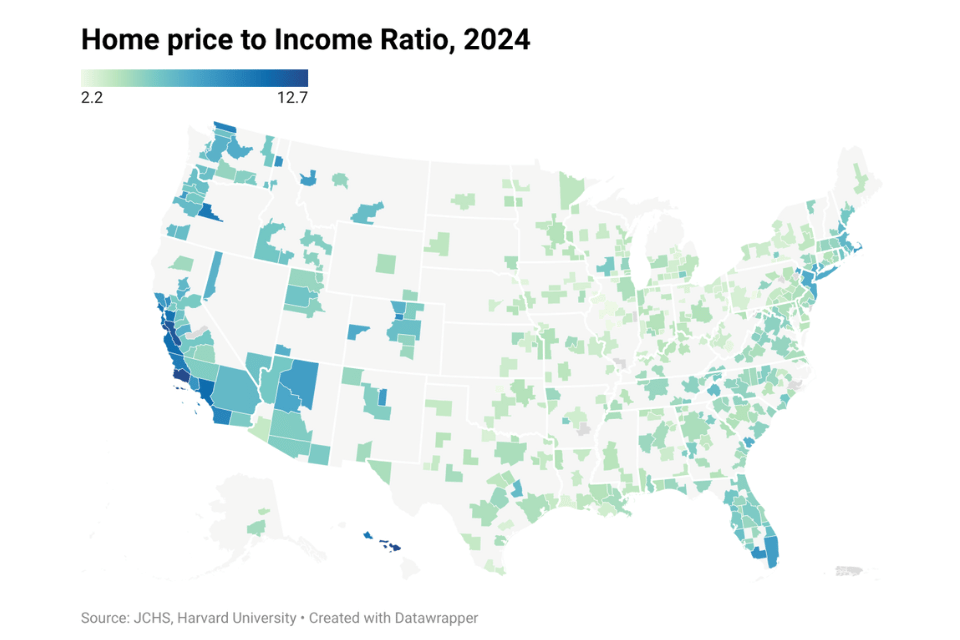
Affordability concerns also point to cities like Rockford, IL as top destinations for buyers in 2026, supported by low entry prices (median home price of $232,000 in Q3 2025 versus $410,000 for the U.S.), quality of life amenities, and manageable commuting times. In fact, Rockford tops several lists of markets favorable for first-time homebuyers, offering opportunities where housing costs align more closely with local income levels. Other Midwest and Northeast markets also continue to capture share due to more balanced conditions relative to pricier coastal or Sun Belt metros.
Sun Belt and Southern Markets Facing Headwinds
On the other side of the divide, numerous Sun Belt and southern metro areas that experienced rapid home price appreciation earlier in the decade are showing signs of cooling or correction. Home prices in a number of markets, particularly across Florida and Texas have seen falling or slowing prices year-over-year. For example, Austin, TX registered a 63% rise in prices from Q4 2020 to Q2 2022 but has seen prices decline by over 6% from the 2024 through Q3 2025. Cape Coral, FL had a price increase of 74% from Q4 2020 to Q2 2022 but has seen a sharp decline of 11% from 2024 through Q3 2025. This divergence reflects the way pandemic migration trends have unwound and how heightened costs including insurance, property taxes, and high mortgage rates are reshaping buyer behavior.
Why Regional Differences Persist
The widening gap between winning and losing markets comes down to fundamental supply and demand dynamics and how they interact with local economic conditions. Markets that saw excessive appreciation relative to job growth or local income levels now face more headwinds as affordability tightens. Regions with steadier demand relative to supply, particularly where home price growth was more measured, tend to retain stronger fundamentals as buyers prioritize value.
While national projections anticipate a slow but broad price growth and a modest shift toward a more balanced market in 2026, they also emphasize that not every metro will feel the same. Those regional differences from the Midwest and Northeast to Gulf Coast and Texas metros underscore the importance of evaluating local conditions when considering buying, selling, or investing.