The Market Hotness Index is formulated through a combination of proprietary data pertaining to housing activity and demand and supply indicators for the 100 most populous counties in the U.S.
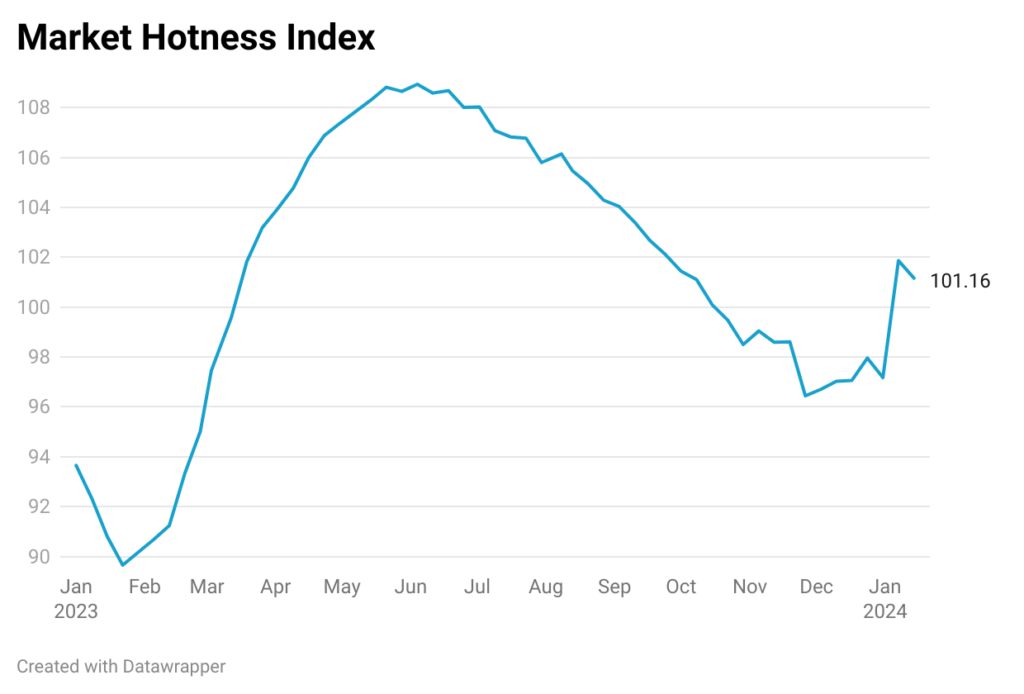
The index is scheduled to be disseminated weekly and serves as a metric to identify markets gaining momentum or waning. A market exhibiting a score in the 95-105 range on this index is considered a balanced market, with a score surpassing this range implying a hotter market, and a score below 95 indicating a cooling market.
The value of the index was 101.16 for the week ending January 14th, 2024, suggesting a balanced market.
The hottest county based on this index is Harris County, TX.