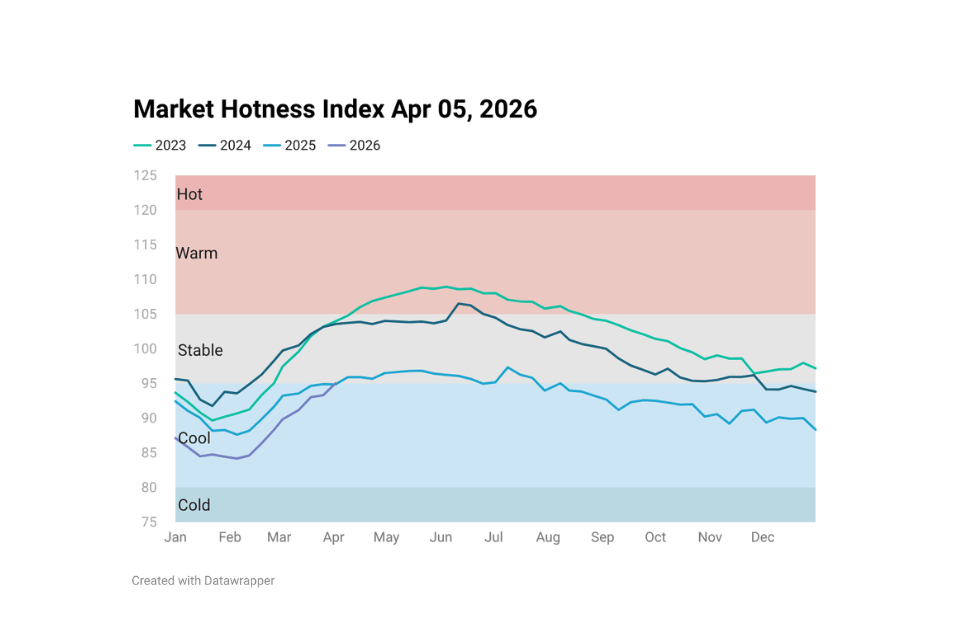
The Housing Market Hotness Index rose to 95.01 for the week ending April 5, 2026, moving out of the cool zone into the stable range. Even so, overall market conditions remain largely unchanged from a year ago. Housing inventory has edged slightly higher, with 1.36 million homes available in March 2026 compared to 1.33 million a year earlier. At the same time, sales activity has softened, with the National Association of Realtors reporting 3.98 million existing home sales, which is about 1% lower than March 2025. While the index shows improvement from recent weeks, it has only returned to levels seen at this time last year, reflecting a market still constrained by limited inventory, elevated mortgage rates, and uncertainty in the labor market. Despite the slowdown in transactions, home prices on average have remained resilient.
Market conditions, however, continue to vary widely by region. In California, counties such as Santa Clara, San Francisco, and San Mateo remain among the most competitive, supported by strong demand. Similar strength is visible in select markets like Monroe County, New York, and Kent County, Michigan. In contrast, several areas are experiencing more subdued activity, including parts of Florida and Texas, as well as Davidson County, Tennessee, and Honolulu County, Hawaii. These differences underscore a broader pattern of divergence across the housing market, where local dynamics are increasingly shaping outcomes.
*Index values are subject to revision as deemed necessary, contingent upon the receipt of new or updated data.