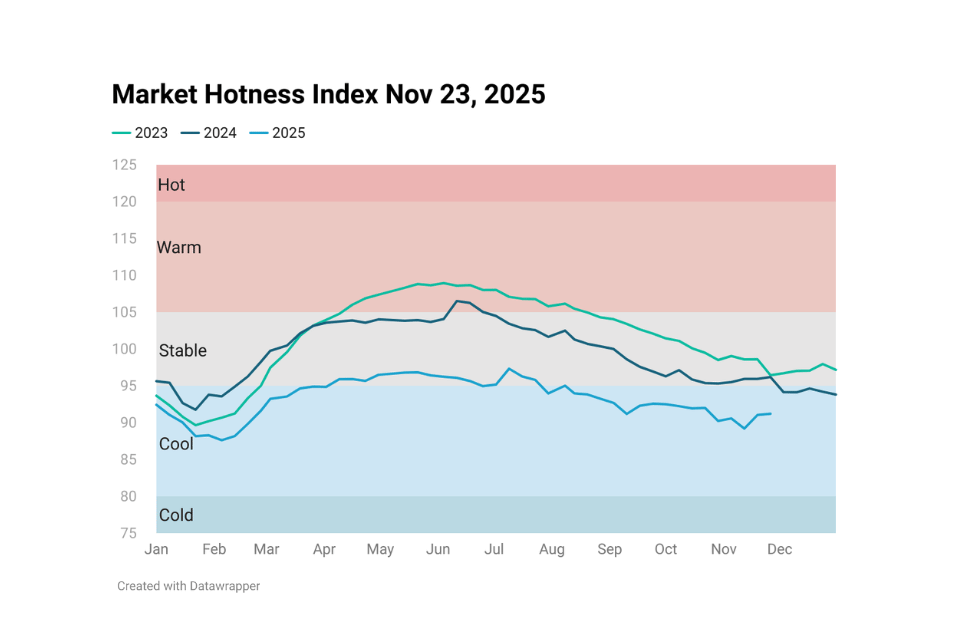
Housing Market Hotness Index Nov 30, 2025
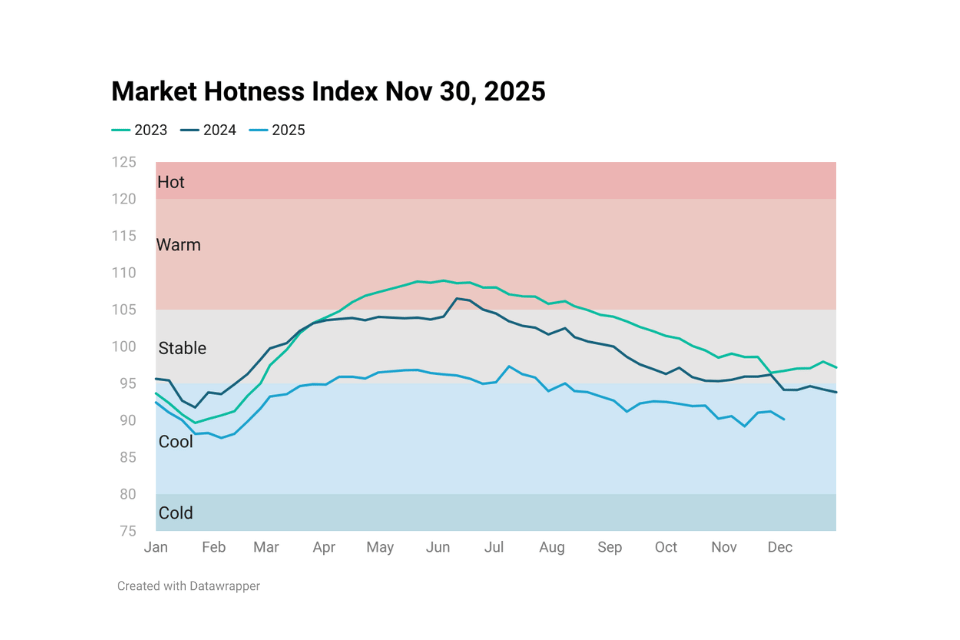
The U.S. Housing Market Hotness Index dipped to 90.14 at the end of November, highlighting a market still frozen by affordability challenges and seller hesitation. While many regions remain sluggish, parts of the Northeast and Midwest continue to show strong demand and faster sales activity. Florida and Texas, however, remain among the softest markets in the country.
Housing Market Hotness Index Nov 30, 2025 Read More »