Housing Market Hotness Index Mar 29, 2026
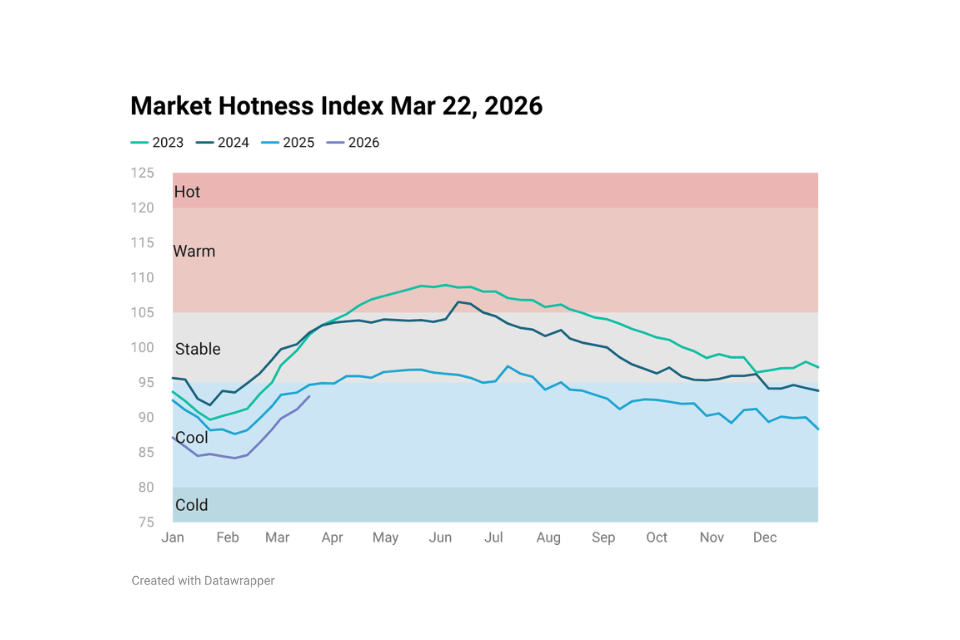
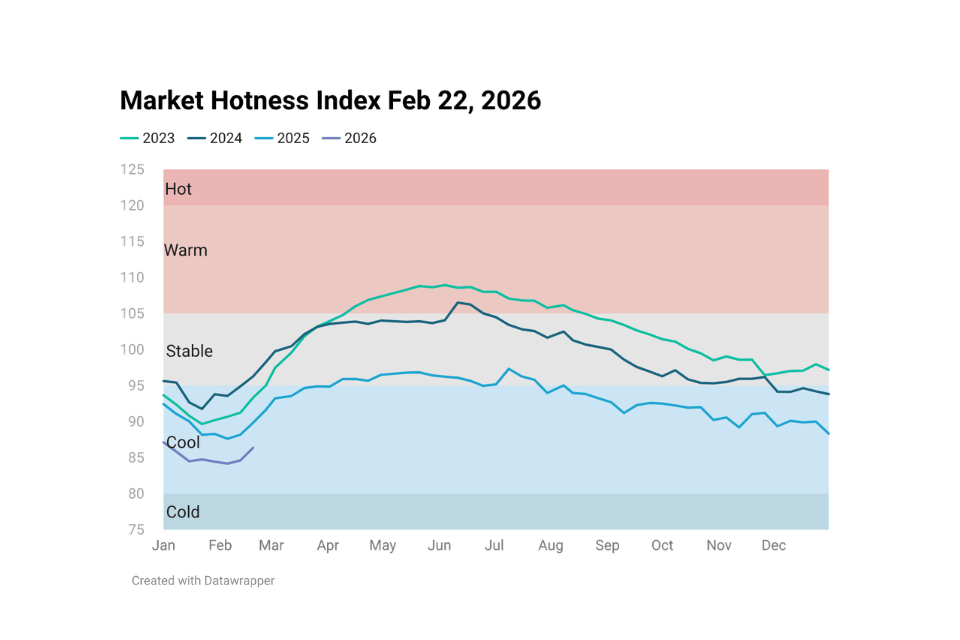
Housing market activity edged higher at the end of March but remains below last year’s levels. Rising mortgage rates and signs of a softening labor market are adding new pressure to an already strained affordability environment.
Housing Market Hotness Index Mar 29, 2026 Read More »