Economic Indicators
Indicators that provide signals about the current state and future direction of the economy and the housing market.
30-yr Fixed Rate Mortgage
| JAN. 2025 | JAN. 2026 | DEC. 2026 FORECAST |
|---|---|---|
| 7.0% | 6.1% | 6.1% |
30-yr FRM: Freddie Mac®, Forecast: Veros
Unemployment Rate
| JAN. 2025 | JAN. 2026 | DEC. 2026 FORECAST |
|---|---|---|
| 4.0% | 4.3% | 4.6% |
Unemployment rate: Bureau of Labor Statistics, Forecast: Veros
Inflation Rate
| JAN. 2025 | JAN. 2026 | DEC. 2026 FORECAST |
|---|---|---|
| 3.0% | 2.4% | 2.6% |
Inflation: Bureau of Labor Statistics, Forecast: Veros
Hourly Earnings
| JAN. 2025 | JAN. 2026 |
|---|---|
| $35.84 | $37.17 |
Source: Bureau of Labor Statistics
Housing Inventory
| JAN. 2025 | JAN. 2026 |
|---|---|
| 1.18 Million | 1.22 Million |
Source: National Association of Realtors
Housing Starts
| DEC. 2024 | DEC. 2025 |
|---|---|
| 1.514 Million | 1.404 Million |
Source: Census.gov
Housing Market Hotness Index
Discover housing market trends with the Market Hotness Index, a weekly metric utilizing proprietary data on housing activity, demand, and supply indicators across the top 100 U.S. counties.
- The Market Hotness Index is formulated through a combination of proprietary data pertaining to housing activity and demand and supply indicators for the 100 most populous counties in the U.S.
- The index is scheduled to be disseminated weekly and serves as a metric to identify markets gaining momentum or waning. A market exhibiting a score in the 95-105 range on this index is considered a stable market, with a score surpassing this range implying a hotter market, and a score below 95 indicating a cooling market.
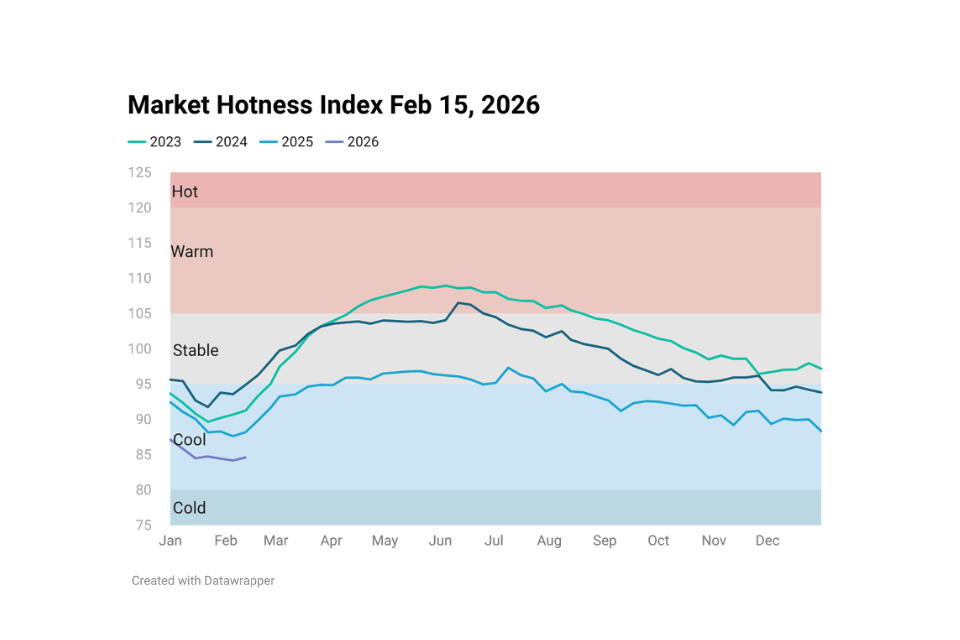
Housing Market Hotness Index Feb 15, 2026
The U.S. Housing Market Hotness Index edged up to 84.61 for the week ending February 15, 2026, but continues to hover within a narrow range. Despite the 30-year fixed mortgage rate falling to 6.01%, its lowest level since 2022, buyers and sellers remain cautious, limiting transaction activity.
Read More →
Housing Market Hotness Index Feb 08, 2026
The U.S. Housing Market Hotness Index fell to 84.17 for the week ending February 8, 2026, signaling continued cooling in housing activity. Although mortgage rates are 80 basis points lower than a year ago, affordability remains strained as home prices stay elevated and labor market softness dampens buyer confidence.
Housing Market Hotness Index Feb 01, 2026
The U.S. Housing Market Hotness Index slipped modestly, reflecting a market that remains in a slump. Lower mortgage rates and stable prices have improved affordability compared to last year, but a soft labor market is keeping many buyers on the sidelines.
Housing Market Hotness Index Jan 04, 2026
The U.S. Housing Market Hotness Index slipped at the start of 2026, highlighting how affordability challenges continue to restrain buyer activity. While modest relief may emerge from lower mortgage rates, stronger income growth, and proposed federal housing policies, the market remains deeply regional.
Housing Market Hotness Index Jan 25, 2026
The U.S. Housing Market Hotness Index slipped in January 2026 despite mortgage rates sitting 85 basis points below last year’s levels. Ongoing affordability pressures and limited seller participation continue to weigh on activity.
Housing Market Hotness Index Dec 28, 2025
The U.S. Housing Market Hotness Index ended 2025 firmly in the cool zone, reflecting a year marked by high mortgage rates, elevated home prices, and constrained affordability. While parts of the Northeast and Midwest remained relatively strong, many Sun Belt markets struggled as earlier price gains left buyers priced out.